My Blog

Pondhe is a typical village from eastern parts of Pune district of Maharashtra state. However, the Ponda area is not typical of the region where rainfall vagaries and large-scale groundwater overabstraction have plagued villages for the last ten-twelve years.The Ponda watershed is located about 30 km from Saswad town, the headquarters of Purandar taluka. Ponda village can be best approached by the Jejuri-Yavat road, branching off from the Malshiras village. The approach to Jejuri is through Saswad. The base map of the watershed prepared using Survey of India Toposheet numbered 47/J/7/NW. Ponda village is situated at the bottom of the broad ridge marking the western divide of the watershed. The area is bounded by the latitudes 18º 25′ N and 18º 27’30″N and by the longitudes 74º 15′ E and 74º 17’30” E.

The project area covers a microwatershed just under 8.41 km2 (about 841 hectares) and slopes towards the east. The most obvious features in the watershed are a cluster of farms along the margins of the watershed. The watershed is somewhat anomalous to the regional trend of microcatchments in this area. The area actually runs parallel to the divide between the Bhima and Karha river basins and forms a part of the Karha system. Most other sub-catchments of the Karha drain southwards and southeastwards, but locally, the Ponda sub-basins follow an anomalous pattern that is often discordant to the regional hydrology.

Map with function of varying height(Elevation Map)

Elevation Model of Pondhe

Well Monitoring
There are many wells in the area, primarily because it is a low rainfall area. However, the area has witnessed enormous development of groundwater resources through dug wells and bore wells. All these wells are numbered appropriately and base information like latitude/longitude, elevation, diameter and depth is collected for each. In ponde there are 16 wells which are under observation.

Table 5: Inflow and discharge values for ‘V’ notch in Ponda (Driscoll, 1986)
 
Date Inflow from ‘V’ notch in inches  Discharge in lit/min
30.03.06  9    2095.80
15.04.06   7    1118.19
30.04.06 7.5  1328.60
15.05.06 8   1561.24
30.05.06  8.5 1816.73
30.08.06 13 5255.34
15.09.06  16  8831.67
30.09.06  15  7515.72
15.10.06  12    4302.25
30.10.06  8    1561.23
15.11.06 7.5  1328.60
30.11.06      6      760.53
15.12.06  5     482.13
30.12.06    6    760.54
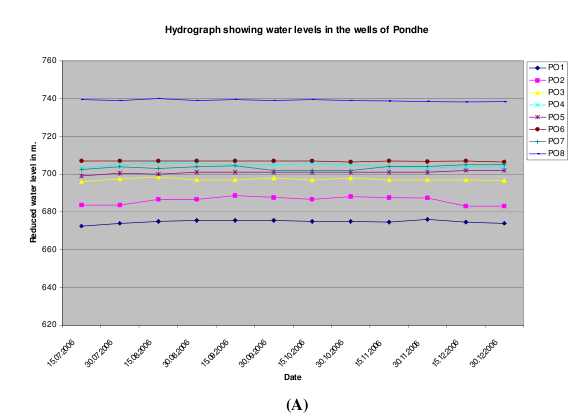
Well hydrograph for Ponda from July to December, 2006
The hydrographs above generally indicate the following:
  • Some wells do not show any significant water level fluctuation.
  • Other wells clearly show water levels fluctuations, beginning with a rise at the start of the monsoon and then a drop going into the dry season.
These two observation clearly indicate that wells can be classified as being in “recharge” or “discharge” zones. Also, it is likely that some of the wells (showing water level fluctuations) are actually being pumped more than the ones that show relatively minor fluctuations.
ACWADAM has installed a ‘V’ notch on the Ponda stream in March, 2006. The data is collected on fortnightly basis. Based on the inflow from the ‘V’ notch, discharge is calculated. Monitoring is in progress and the discharges on certain dates is presented below.

Based on these discharge values, a stream hydrograph was prepared and the total volume of water generated from September to December, 2006 was calculated. The total volume of water generated is about 712333 m3 , which over an area of some 1000 hectares is about 71 mm. As latest data comes in, this figure will be refined and the total discharge is expected to be in excess of 100 mm equivalent of the depth of water over the watershed area.

Pumping test: 
The pumping test programme for the project commenced with a few pumping tests conducted on some wells of Ponda, during different seasons. The first pumping test was conducted in August, 2006. Later on, tests were conducted in Dec, 2006 and Feb, 2007.The data for all these tests is being comprehensively analysed.
The preliminary analysis of data for three wells of Ponda is given below.
Well no.Static water level in (m)Pumping TimeTotaldraw down (m)Transmisivitystorativity       %Recoveryspecific  Capacilty lit per min/m
PO37.55   300.4571.820.0490.30m in 60 min. 69.53
PO75.7350.67114.820.089Very  slow recovery; 
not measurable
in 60 min.
       —
PO93.021001.4745.520.0740.12m in 90 min.101.09
The transmissivity and storativity was calculated using the Cooper-Jacob method (1971). From the analysis, we can observe that well no. PO7 shows a higher value of Storativity as well as Transmissivity, as compared to the other two wells. But generally the value of Storativity is quite high in the aquifer/s and also the transmissivity values are moderate for the aquifer/s. Using values of storativity and transmissivity for two areas (the head regions of the two main sub-watersheds in Ponda), estimates of water availability were calculated to enable GGP to plan for the community based groundwater management initiative in Ponda.